Welcome!
These services are provided at no cost. You can try them as a visitor or set up a free user account. Visitors can only run analysis against UlpiaTech data. Users are able to analyze their own files. Feedback and constructive criticism are welcome so, please contact us. If you want/can contribute with ideas, data, etc. we will happily embrace your help and make sure you will receive the credit you deserve for your contribution. Furthermore, if you need IT help independent of these API, we provide per request services as described on Services page.
Important!
In order to properly run these APIs against your own files you may need to do some file "cleaning". The most important thing is to save tab delimited files in which data starts in colum 1 and row 1, taxa are listed in row 1 starting in column 2 and samples are listed in column 1 starting in row 2.
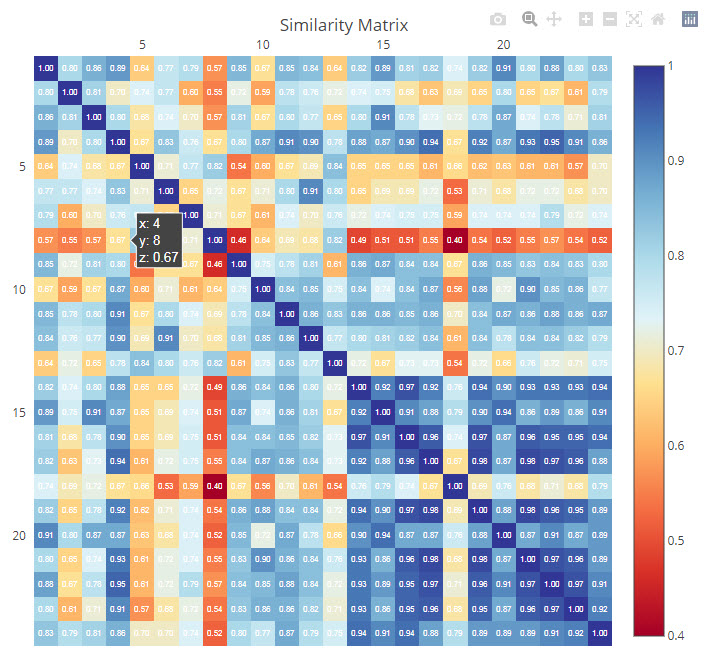
One Section Sample to Sample Similarity:
In order to fix potential issues try one of the followings:
• Copy the data, paste it into a clean excel file sheet and save that sheet as a tab delimited file
• Plotting big files (~100 rows) takes more than 30 seconds. We plotted a 97 sample file in 34.61 seconds, Please be patient!
• You may want to truncate your file (reduce the number of samples) to make sure it works, then run the full file.
Taxon Distribution Plots:
Instead of creating one distribution chart per file, UlpiaTech builds a series of plots, one for each taxon in the input file. Curently the number of taxa
to be plotted is preset to 80 taxa. We can increase this to a number that covers most of the needs. Furthermore, future implementations
will set up the number of taxa to be plotted dinamically eliminating the number of taxa to be plotted limitation. Also, a one distribution chart per file is to
be implemented. This API allows you to:
• Plot distribution of 80 taxa from the input files
• Create a marker list by clicking the plots' horizontal bars.
Palynomorph Based Paleoclimate Analysis:
Spore and pollen data are analyzed for the purpose of identifying cold, hot, wet, and dry paleoenvironments. Palynomorph datafiles can include dinocysts. However, no climate attribute is associated with dinoflagellates so a certain proportion of each of the analysed sample will be undetermined with respect to the above mentioned climate parameters. Furthermore not all spore and pollen in your file will match UlpiaTech "database". UlpiaTech welcomes welcomes contribution that will enhance its spore/pollen paleoclimate database.
Species Diversity:
This API computes and plots:
• Shannon Wiener Diversity Index
• Hmax
• Eveness
• Species Rchness